For this Black Friday, Sematext wishes you:
- more products sold
- more traffic and exposure
- more logs
![🙂]()
Now seriously, applications tend to generate a lot more logs on Black Friday, and they also tend to break down more – making those logs even more precious. If you’re using the Elastic Stack for centralized logging, in this post we’ll share some tips and tricks to prepare you for this extra traffic.
If you’re still grepping through your logs via ssh, doing that on Black Friday might be that more painful, so you have two options:
- get started with the Elastic Stack now. Here’s a complete ELK howto. It should take you about an hour to get started and you can move on from there. Don’t forget to come back to this post for tips!
![🙂]()
- use Logsene, which takes care of the E(lasticsearch) and K(ibana) from ELK for you. Most importantly for this season, we take care of scaling Elasticsearch. You can get started in 5 minutes with Logstash or choose another log shipper. Anything that can push data to Elasticsearch via HTTP can work with Logsene, since it exposes the Elasticsearch API. So you can log directly from your app or from a log shipper (here are all the documented options).
Either way, let’s move to the tips themselves.
Tips for Logstash and Friends
The big question here is: can the pipeline easily max out Elasticsearch, or will it become the bottleneck itself? If your logs go directly from your servers to Elasticsearch, there’s little to worry about: as you spin more servers for Black Friday, your pipeline capacity for processing and buffering will grow as well.
You may get into trouble if your logs are funnelled through one (or a few) Logstash instances, though. If you find yourself in that situation you might check the following:
- Bulk size. The ideal size depends on your Elasticsearch hardware, but usually you want to send a few MB at a time. Gigantic batches will put unnecessary strain on Elasticsearch, while tiny ones will add too much overhead. Calculate how many logs (of your average size) make up a few MB and you should be good.
- Number of threads sending data. When one thread goes through a bulk reply, Elasticsearch shouldn’t be idling – it should get data from another thread. The optimal number of threads depends on whether these threads are doing something else (in Logstash, for example, pipeline threads also take care of parsing, which can be expensive) and on your destination hardware. As a rule of thumb, about 4 threads with few things to do (e.g. no grok or geoip in Logstash) per Elasticsearch data node should be enough to keep them busy. If threads have more processing to do, you may need more of them.
- The same applies for processing data: many shippers work on logs in batches (recent versions of Logstash included) and can do this processing on multiple threads.
- Distribute the load between all data nodes. This will prevent any one data node from becoming a hotspot. In Logstash specify an array of destination hosts. Or, you can start using Elasticsearch “client” nodes (with both node.data and node.master set to false in elasticsearch.yml) and point Logstash to two of those (for failover).
- The same applies for the shipper sending data to the central Logstash servers – the load needs to be balanced between them. For example, in Filebeat you can specify an array of destination Logstash hosts or you can use Kafka as a central buffer.
- Make sure there’s enough memory to do the processing (and buffering, if the shipper buffers in memory). For Logstash, the default 1GB of heap may not cope with heavy load – depending on how much processing you do, it may need 2GB or more (monitoring Logstash’s heap usage will tell for sure).
- If you use grok and have multiple rules, put the rules matching more logs and the cheaper ones earlier in the array. Or use Ingest Nodes to do the grok instead of Logstash.
Tips for Elasticsearch
Let’s just dive into them:
- Refresh interval. There’s an older blog post on how refresh interval influences indexing performance. The conclusions from it are still valid today: for Black Friday at least, you might want to relax the real-time-ness of your searches to get more indexing throughput.
- Async transaction log. By default, Elasticsearch will fsync the transaction log after every operation (2.x) or request (5.x). You can relax this safety guarantee by setting index.translog.durability to async. This way it will fsync every 5s (default value for index.translog.sync_interval) and save you some precious IOPS.
- Size based indices. If you’re using strict time-based indices (like one index every day), Black Friday traffic may cause a drop in indexing throughput like this (mainly because of merges):
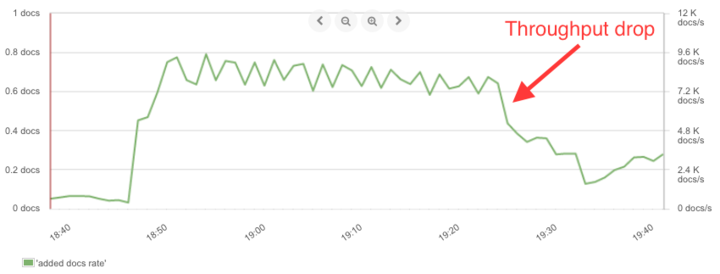
Indexing throughput graph from SPM Elasticsearch monitor
In order to continue writing at that top speed, you’ll need to rotate indices before they reach that “wall size”, which is usually at 5-10GB per shard. The point is to rotate when you reach a certain size, and not purely by time, and use an alias to always write to the latest index (in 5.x this is made easier with the Rollover Index API).
- Ensure load is balanced across data nodes. Otherwise some nodes will become bottlenecks. This requires your number of shards to be proportional to the number of data nodes. Feel free to twist Elasticsearch’s arm into balancing shards by configuring index.routing.allocation.total_shards_per_node: for example, if you have 4 shards and one replica on a 4-data-node cluster, you’ll want a maximum of 2 shards per node.
- Overshard so you can scale out if you need to, while keeping your cluster balanced. You’d do this by setting a [reasonable] number of shards that has enough divisors. For example, if you have 4 data nodes then 12 shards and 1 replica per shard might work well. You could scale up to 6, 8, 12 or even 24 nodes and your cluster will still be perfectly balanced.
- Relax the merge policy. This will slow down your full-text searches a bit (though aggregations would perform about the same), use some more heap and open files in order to allow more indexing throughput. 50 segments_per_tier, 20 max_merge_at_once and 500mb max_merged_segment should give you a good boost.
- Don’t store what you don’t need. Disable _all and search in specific fields (and search in “message” or some other general field by default via index.query.default_field to it). Skip indexing fields not used for full-text search and skip doc values for fields on which you don’t aggregate.
- Use doc values for aggregations (instead of the in-memory field data) – this is the default for all fields except analyzed strings since 2.0, but you’ll need to be extra careful if you’re still on 1.x. Otherwise you’ll risk running out of heap and crash/slow down your cluster.
- Use dedicated masters. This is also a stability measure that helps your cluster remain consistent even if load makes your data nodes unresponsive.
You’ll find even more tips and tricks, as well as more details on implementing the above, in our Velocity 2016 presentation. But the ones described above should give you the most bang per buck (or rather, per time, but you know what they say about time) for this Black Friday.
Final Words
Tuning & scaling Elasticsearch isn’t rocket science, but it often requires time, money or both. So if you’re not into taking care of all this plumbing, we suggest delegating this task to us by using Logsene, our log analytics SaaS. With Logsene, you’d get:
- The same Elasticsearch API when it comes to indexing and querying. We have Kibana, too, in addition to our own UI, plus you can use Grafana Elasticsearch integration.
- Free trials for any plan, even the Black Friday-sized ones. You can sign up for them without any commitment or credit card details.
- No lock in – because of the Elasticsearch API, you can always go [back] to your own ELK Stack if you really want to manage your own Elasticsearch clusters. We can even help you with that via Elastic Stack consulting, training and production support.
- A lot of extra goodies on top of Elasticsearch, like role-based authentication, alerting and integration with SPM for your application monitoring. This way you can have your metrics and logs in one place.
If, on the other hand, you are passionate about this stuff and work with it, you might like to hear that we’re hiring worldwide, on a wide range of positions (at the time of this writing there are openings for backend, frontend (UX, UI, ReactJS, Redux…), sales, work on Docker, consulting and training). 